Smart Earnings Forecast on IBES Earnings Data
We have expanded our suite of predictive earnings model to use Thomson’s IBES earnings data products. Dating back to 1998 at the DAIS Group, we have been developing predictive earnings models using FirstCall’s customized earnings databases. Nevertheless, recent vendor consolidation coupled with technology advances has eliminated most of the traditional differences as well as advantages among various data sources. At present, the primary earnings services providers offer a broad range of standard products and delivery options, including real-time web-based systems.
With the changing data vendor landscape, we have received numerous requests to investigate whether there are substantive discrepancies among certain datasets. This paper is one of a series where we hope to document any systematic differences, which could impact the performance, of models built on the same market measures from different vendors or the same vendor. The research literature suggests there is a wide range of factors that could affect modeling outcome, including periodicity, data source, compilation methodology, and adjustments or lack thereof.
In this paper, we share our findings on the implementation of predictive earnings class of models on different datasets from the same vendor. To perform this analysis, we implemented the same version of our Smart Earnings Forecast (SEF)[1] on Thomson’s IBES and Firstcall detail earnings databases. The IBES data is part of a product set the company refers to as QFS (Quantitative File System), hereafter IBES. After implementing the same SEF formulation on these two products from Thomson, we attempt to identify qualitative and quantitative model performance differences between these platforms.
Table 1 displays earnings estimates correlation statistics for Quarter 1, Fiscal Year 1, and Fiscal Year2 from IBES and FirstCall for the S&P500 and Full Universe. The values highlight a strong relationship between these two sources with correlations ranging from .97 to .99. The relationship, at the high-end of this range, is consistent to the level of being virtually identical. Moreover, both datasets cover on average more than 3000 securities.
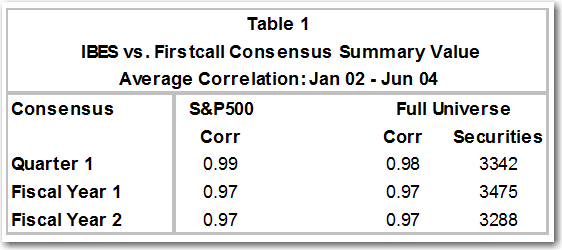
Although our examination is on a two and half-year period ending in June 2004, the same testsconducted on longer periods going back to 1998 revealed no material difference between the two time periods. The short period is selected to facilitate optimal comparison of IBES and FirstCall data as well as model results based on business calendar month end[2].
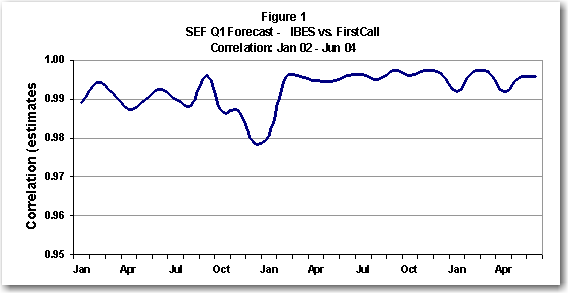
Having established the similarity of the IBES and FirstCall earnings data, we next explored the relationship of SEF implementation on these sources. Figure 1 illustrates SEF Q1’s correlation is high. The average correlation of 99% indicates the two models’ ability to predict future earnings is consistent. Given the model’s identical construction on the two databases, the graphed values are evidence of near perfect association between the earnings data used as input. There’s no material difference in the Fiscal Year1 and Fiscal Year2 relationship over the same period.
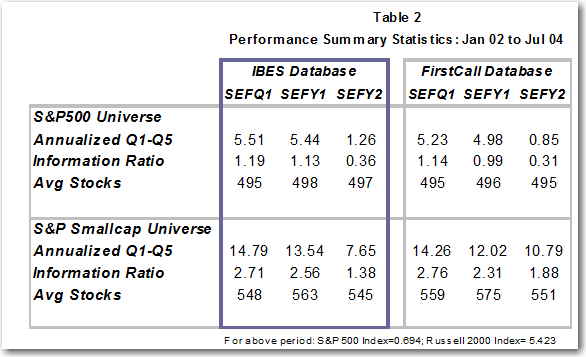
The SEF performance statistics in Table 2 is based on IBES and FirstCall data for two broadly followed universes – S&P500 and the S&P Small-Cap universe. While there are some minor differences between the two predictive earnings models’ performance on the indicated data sets, the similarities dominate. There’s very low deviation in the number of securities that are covered in both universes. Moreover, the annualized quintile spreads for the three forecasted (Q1, FY1, FY2) measures averages 4.07 percent on IBES versus 3.69 percent on Firstcall for the S&P500 universe. For the S&P Small-Cap, the model posted 11.99 percent as compared to 12.36 on the respective databases. The average difference is less than 40 basis points. The risk profile, as characterized by the information ratio (IR), of the two model implementations paints a similar picture. The alpha per unit of risk of each forecasted item indicates no material difference on the two databases. For example, the S&P500 universe’s IR for SEF Q1 is 1.19 on IBES versus 1.14 on Firstcall. While SEFY2 posted a .50 difference on the S&P Small-cap universe (1.38 vs. 1.88), the other measures generated IRs with significantly less distinctions.
The foregoing analysis provides convincing evidence that there is no material performance difference for implementing a predictive earnings model on the IBES QFS or Firstcall databases[3]. As such, QRG is offering its suite of Smart Earnings Forecast products on the IBES QFS database. This implementation provides clients a number of benefits. First, with its nearly perfect correlation, the SEF implementation on IBES maintains continuity for clients who are accustomed to using the Firstcall version we implemented during our tenure at DAIS Group. Second, the deeper IBES data history enables us to back fill the model scores to include several more years. This expansion guarantees more coverage of the Markets’ historical variations. Lastly, IBES’ standard production process and consistent availability enables us to deliver our SEF product in a much more timely and predictable fashion. This provides clients a wider pre-market-open processing window for incorporating our SEF rankings into their internal investment process.
In summary, the resulting performance of QRG’s SEF on two distinct detail earnings database products indicates there’s no content advantage in using one versus the other. This should come as no surprise to most practitioners. Competitive, technological, and regulatory forces have promoted efficiency in the earnings collection and distribution landscape over the past decade. Therefore, clients have a high probability of being equally well served by most earnings database choices. The foregoing examination suggests that the earnings content field is fairly leveled. Consequently, quality issues relating to delivery, production, and customer service are bound to be the driving forces of differential advantage.
