This paper is the first of a series where we will share the results[1] of our research using detail analyst forecast data from Thomson Financial to develop new classes of powerful component factors called ESIS (Estimate Specific Information Score). The ESIS platform is used to gauge the relationship of a range of analyst forecasts and their informational value. While future studies will examine ESIS formulations for non-earnings forecast data, the following research reviews the measure’s application and strength in improving existing earnings based models. In this context, ESIS utilizes earnings estimate data from different fiscal periods to generate an enhanced securities ranking system whose objective is to capture the degree to which the U.S. market assimilates (or responds to) information in price formation. Research indicates the market’s response to released earnings information is incomplete (Stickel 1991, 1995; Chan, Jegadeesh, and Lakonishok 1996; Womack 1996.) ESIS serves as a proxy for analyst characteristics that are manifested in the forecasting of company information and the inefficient dissemination thereof.
Maximize detail analyst forecasts information
ESIS leverages detail analyst data[2] to catalog and exploit important characteristics and systematic differences in analysts’ forecasting ability. How does ESIS accomplish this goal? This factor builds on our extensive experience in modeling detail analyst data at DAIS Group, including innovative work on factors that differentiate, among other things, leading and following forecasts (Herzberg, Guo, Brown 1999; Herzberg, Wang 2002). Specifically, QRG considers a leading analyst forecast as one that moves away from or goes through the consensus while a herding or following forecast goes to or toward the consensus. Evidence of herding in earnings forecasts by security analysts is documented through examination of various measures including departure from consensus and timing of forecasts (Hong, Kubik, Solomon 1999)
To illustrate the general theory, let’s assume three of the many analysts, designated as A1, A2, A3, who cover company XYZ are each forecasting 10 cents for the firm’s next fiscal period. The consensus, including these and other analysts’ estimates, is 15 cents. Let’s further assume that A3 goes to 13 cents or closer to the consensus, A2 goes to 15 cents, and A1 goes to 17 cents or through the consensus. These three estimates probably reflect different assumptions and skill sets. More important, the forecasts are unlikely to contain the same degrees of informational value and reliability. ESIS is designed to capture the information content of analysts’ departure from consensus while accounting for biases and lags.
Utilizing a proprietary implementation of the concepts for identifying influential analyst characteristics, we compute a score for each security for various forecast periods such as Quarter1, Fiscal Year1, and Fiscal Year2. Each calculated ESIS is aggregated for each security. Using this raw version of the model formulation, we first performed regression analysis to confirm the score’s predictive capability by regressing subsequent returns on the ESIS variable. The results of the analyses showed a positive and meaningful relationship between total returns and ESIS values.
To build ranking measures for this factor, the raw ESIS values are normalized within each factor’s respective universe. Moreover, typical quality control and data validity are applied to ensure the integrity of the computed raw scores. Lastly, the values for each fiscal period are optimally combined to produce ESIS rankings that quantify the market sentiment that analysts convey to investors in their earnings forecasts.
ESIS value added implication
How can ESIS add value to existing earnings framework? Although estimate revision, earnings surprise, and similar earnings based models continue to be a mainstay of most managers’ processes, recent analyses indicate these models are not as effective in capturing the variations in return as they did in the 1980’s and 1990’s (Butman 1998;Thomas 2003). While the reasons for the lackluster performance vary, one of the prevailing conclusions is that consensus estimate revisions has lost its status as a proxy for changes in market sentiment (Zeng 2004.) The conclusions on the declining power of revision as a leading market indicator are primarily based on aggregated analyst earnings data and revisions. The use of detail individual analyst forecasts is an important area that most earnings research has heretofore overlooked. The results in the following pages provide some insights on how ESIS and similarly designed platforms can exploit granular analyst information to bolster revisions and other earnings based models.
Improvement to revision and surprise models
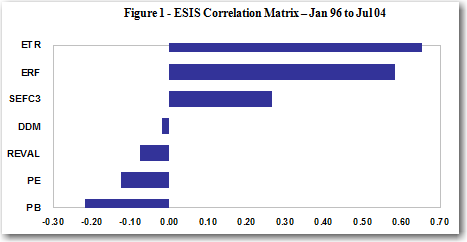
As Figure 1 illustrates, ESIS has moderately high relationships with growth and momentum factors while showing low to negative correlations with value measures. ESIS’ relationship with revision and forecasted surprise (hereafter ETREND and ERF[3] are used interchangeably for these two categories of models) could help to enhance strategies that utilize such traditional models.
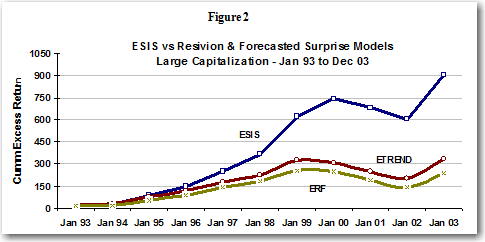
 To determine whether ESIS is suitable in bolstering existing strategies, we conducted numerous single and multifactor back tests for various universes and compared these results with our ETREND and ERF. For the ten-year period starting in January 1993, ESIS posted approximately 900 percent cumulative excess return[1] to significantly outpace revision (330 percent) and forecasted surprise (240 percent). The factor’s pattern of superior performance was also evident after the 2000 TMT bubble.
 Specifically, ESIS produced an approximate 7 percent average excess return for the TOP 1000 market-cap and more than 16 percent for the S&P Small-cap universe from January 2000 to December 2003. ETREND and ERF results range from approximately negative -1 to negative –5 percent during the same period for the large and small market-cap universes, see Table 1.To determine whether ESIS is suitable in bolstering existing
 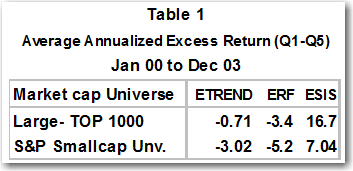 strategies, we conducted numerous single and multifactor back tests for various universes and compared these results with our ETREND and ERF. For the ten-year period starting in January 1993, ESIS posted approximately 900 percent cumulative excess return[4] to significantly outpace revision (330 percent) and forecasted surprise (240 percent). The factor’s pattern of superior performance was also evident after the 2000 TMT bubble.
Bolstering factors + strategies
We also evaluated the ESIS ranks’ contribution to strategies that are focused on subsets of the broad market. In sector specific tests that use the MSCI and S&P GICS[5] definitions, ESIS displays strong ability to differentiate favorable and unfavorable investments within economic sectors. The factor’s performance relative to ETREND is illustrated in Table 2. As shown, ESIS is a noticeably better indicator of market sentiments in all sectors, except Tele-communication and Utilities. Moreover, a simple multifactor formulation (50/50 Combo) that equally weighs ESIS and ETREND bested the standalone factor in nine of the ten sectors.
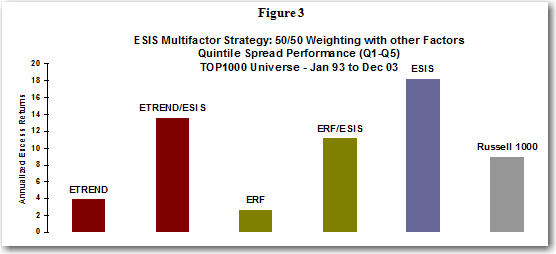
 For standalone and multifactor applications, ESIS seems to predict total future returns convincingly in various market capitalization universes. As Figure 3 shows, ESIS generated excess return of approximately 17 percent for the TOP 1000 market-cap universe. These results are more than 4 times the performance of the next closest single model, ETREND. In addition, a basic formulation that equally weights ESIS ranks with another earnings factor significantly outperformed in historical back tests. The total annualized excess returns to each ESIS combination model is at least 3 times greater than the standalone revision and forecasted surprise models.
 Consistent with our experience and academic research, the above ESIS out performance in large-cap universe suggests applying similar multifactor strategies to a small capitalization universe should produce substantially better results. As Figure 4 confirms, the total annualized excess returns to ESIS and related combinations are 20 percent or more from January 1995[6] to December 2003.
ESIS performance indicates it can serve as a more effective leading indicator of market sentiment than the traditional revision and forecasted surprise models that currently drive many managers’ investment strategy. The use of individual analyst forecasts as the primary input provides QRG the option to address a number of systematic biases as well as differences in ability and competence that are pervasive in the much modeled consensus analyst information. This access to individual analyst views combined with our extensive modeling experience allowed us to quantify much more of the useful earnings estimate information that analysts disseminate. ESIS’ superior results as a component factor coupled with its contribution to multifactor strategies makes it an attractive complement or alternative to revision and forecasted surprise models.
Research Update: December 2004
References:
Butman, R. (1998),  “Estimate Revision and Earnings Surprise Backtest Review,” 16th Annual Equity Conference, LaQuinta, California.
Chan, L. K. N. Jegadeesh, and J. Lakonishok (1996),  “Momentum Strategies,” Journal of Finance, 51, 1681-1713.
Clement, M. (1999), “Analyst Forecast Accuracy: Do Ability, Resources and Portfolio Complexity Matter?” Journal of Accounting and Economics, Vol 27, No. 3, 285-303.
Jacob, J., T. Lys, and M. Neale (1999),  “Expertise in Forecasting Performance of Security Analysts.”  Journal of Accounting and Economics, Vol. 28, No. 1, 51-82.
Hong H. G., J. D. Kubik (2003), “Analyzing the Analysts: Career Concerns and Biased Earnings Forecast,” Journal of Finance, Vol. 58 No. 1.
Hong H, J.D. Kubik, and A. Solomon (1999) “Security Analyst’s Career Concerns and Herding of Analyst Forecasts,” Working Papers
Herzberg, M. M., and S. Wang (2002), “Identifying Lead Analysts for Stock Selection,” Journal of Investing, 11, 25-35.
Herzberg, M. M., James Guo, and Lawrence Brown (1999), “Enhancing Earnings Predictability Using Individual Analyst Forecasts,” Journal of Investing, Vol. 8, No. 2, 15-24.
Mikail, M. B., B. R. Walther, and R. H. Willis (1997), “Do Security Analysts Improve Their Performance With Experience?” Journal of Accounting Research, Vol. 35, No. 1, 131-157.
Stickel, S. E. (1995), “The Anatomy of the Performance of Buy and Sell Recommendations,” Financial Analysts Journal, 51, 25-39.
Stickel, S. E. (1991), “Common Stock Returns Surrounding Earnings Forecast Revisions: More Puzzling Evidence,” The Accounting Review, 66, 402-416.
Thomas J. W.  (2004), “Smart Earnings Forecast on IBES Earnings Data,” Quantitative Research Group Research Update. September, 1-5.
___________ (2003),  “Smart Earnings Forecast Model Overview,” Quantitative Research Group’s 19th Annual Equity Conference, LaQuinta, California.
Womack, K. L. (1996), “Do Brokerage Analysts’ Recommendations Have Investment Value?” Journal of Finance, 51, 137-167.
Zeng, Qi (2004), “Questioning the Significance of Analyst Revision,” Morgan Stanley Equity Research, October 7.
[1] The hypothetical back tests were performed using data believed to be reliable. Quantitative Research Group (“QRG”) does not guarantee the accuracy or completeness of such information. QRG shall not have any liability or obligation for the information accuracy. In no event will QRG be responsible for special, indirect, incidental, or consequential damages which might be incurred or experienced on account of using or relying on this information. These hypothetical results are not related to or suggestive of any specific use or implementation of the models in managing assets. Past performance is not a guarantee of future performance.
[2] Source: Thomson Financial under licensing and redistribution agreement.
[3] ETREND is an earnings revision and ERF is a forecasted surprise model. Contact QRG for details on these models.
[4] Excess return – defined as the top 20% ranked stocks (Quintile 1) minus the bottom 20% (Quintile 5.)
[5] GICS – developed and owned by MSCI and S&P.
[6] January 95 – the inception date of S&P Small-cap benchmark. ESIS historical ranks start in 1989.
